In the method loadData of SheetAPI, it allows user add pie chart to the sheet.
Here comes the code example
var chartFloatings = [{
sheet: 1,
name: 'chart12',
ftype: 'floor',
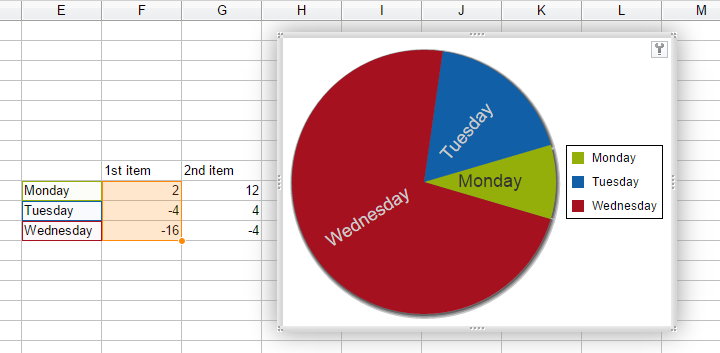
json: '{"seriesPosition":"col","legendPosition":"right","chartType":"pie","floorType":"chart","source":{"series":[["",9,6,11,6]], "labels":[["",9,5,9,5],["",10,5,10,5],["",11,5,11,5]], "usAbs": true },"x":600,"y":60,"width":400,"height":300, id: "chart12"}'
}];
var chartCells = [
{sheet: 1, row: 9, col: 5, json: { data: 'Monday'}},
{sheet: 1, row: 10, col: 5, json: { data: 'Tuesday'}},
{sheet: 1, row: 11, col: 5, json: { data: 'Wednesday'}},
{sheet: 1, row: 9, col: 6, json: { data: 2}},
{sheet: 1, row: 10, col: 6, json: { data: -4}},
{sheet: 1, row: 11, col: 6, json: { data: -16}},
{sheet: 1, row: 9, col: 7, json: { data: 12}},
{sheet: 1, row: 10, col: 7, json: { data: 4}},
{sheet: 1, row: 11, col: 7, json: { data: -4}},
{sheet: 1, row: 8, col: 6, json: { data: '1st item'}},
{sheet: 1, row: 8, col: 7, json: { data: '2nd item'}}
];
var json = {
fileName: 'Chart file',
sheets: [{
name: 'First',
id: 1,
color: 'orange'
}],
floatings: this.chartFloatings(),
cells: chartCells
};
SHEET_API.loadData(SHEET_API_HD, json);
The above code will generate a column chart for a range of cells from E8:G11.
For chart, loadData json object includes at least 4 names: fileName, sheets, floatings and cells.
| Name | Property | Example | Description |
|---|---|---|---|
| File name | fileName | fileName: 'Example Sheet' | Define the file name for this sheet file. |
| Sheet object | sheets | sheets: [{},{}] | Set defined sheet tabs information for this file. |
| Floating object | floatings | floatings: [{},{}] | Set defined floatings information for this sheet file. |
| Cell object | cells | cells: [{},{}] | Set defined cell information for each tab. |
For floating object, the following json object need to be defined.
{
     sheet:1,              // the sheet id of added chart
     name:"chart12",       // name should be unique in this floating
     ftype:"floor",        // define floor type
     json: {
         "seriesPosition"":"col",     // the position of series: row or column
         "legendPosition":"right",    // where legend should be: right, left, top, bottom
         "chartType":"pie",           // Enter "pie" type
         "xTitle":"X",                // OPTION - ignore this if chart does not have X title
         "yTitle":"Y",                // OPTION - ignore this if chart does not have Y title
         "floorType":"chart",         // set floorType as chart
         "source": {
             "series":[["",9,6,11,6]],                                  // the data series position
             "labels":[["",9,5,9,5],["",10,5,10,5],["",11,5,11,5]],     // define the label of data position
             "usAbs": true                                              // this is specific for pie chart
          },
          "x":695,                    // the chart located X position
          "y":164,                    // the chart located Y position
          "width":400,                // the chart width
          "height":300,               // the chart height
          "id":"chart12",             // the chart identify - Need to be same as name
          "sheetId":1                 // the sheet id of added chart - Need to be same as sheet
      }
  }